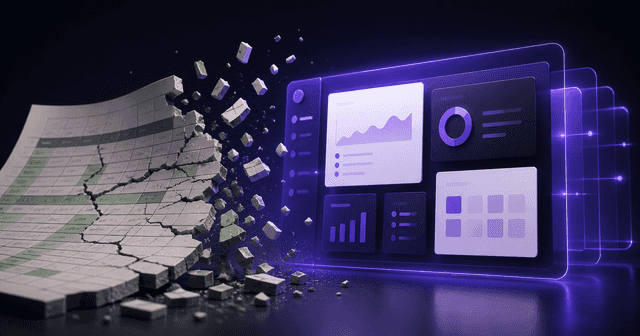
Dashboards that drive decisions, not just charts
Pubblicato il 28 dicembre 2025 · 10 min di lettura
"An effective dashboard doesn't just show numbers — it tells you exactly what to do next. How to understand why most dashboards go unused, and how to design one that becomes part of the daily work."
Almost every company eventually has the same experience with dashboards. You commission a panel, pick the pretty charts, present them in a meeting, everyone nods. For two weeks, people look at it. After a month, nobody opens it anymore.
The problem is rarely the colour or the tool used. The problem is that almost every dashboard shows numbers without telling you what to do with them. They're snapshots when what you need is directions.
An effective dashboard does the opposite: it tells you where there's a problem, why, and what you can do right now. This article is a practical guide to stop building dashboards that get looked at once, and start building ones that actually become part of the way work happens.
Why dashboards go unused
Before talking about how to do them well, it's worth understanding why so many fail. Almost always for one of these reasons:
- They show everything, so nothing is really important: ten charts on the same screen, and the eye doesn't know where to look first.
- Numbers are aggregated at the wrong level: an annual figure for someone making weekly decisions, a daily figure for someone planning quarters.
- No thresholds, no context: "1,500 € in revenue today" tells you nothing. Is that low? High? Compared to what?
- Anomalies don't stand out: if you sell 100 a day and today you sell 60, you need to know today, not at month-end.
- No action attached: you see a project is late, but to do anything you have to open three other systems.
- Designed for whoever requested them, not for whoever should use them: pretty in a meeting, useless on the ground.
- The data isn't reliable: if the dashboard shows wrong numbers one time in three, people stop checking. There's no coming back.
A dashboard that doesn't get used isn't "an extra feature." It's the illusion of control.
The question that changes everything
There's one question that, asked at the start of the project, prevents 90% of useless dashboards: "What decisions do you want to make better or faster thanks to this dashboard?"
It sounds obvious, but almost nobody actually asks it that way. Most projects start from the available data and look for what to do with it. The right flow is the opposite: start from the decisions, and the data follows.
Concrete examples of "decisions" instead of "data":
- "Decide every morning which projects to push to unblock" → data: projects stuck for N days
- "Decide every Friday whether we need to hire or we can cover" → data: hours worked vs hours available in the next 30 days
- "Decide every month which customers the sales team should focus on" → data: real margin per customer with the last 6 months' trend
Every metric has to be traceable to a concrete decision someone makes, at a specific moment. If it isn't, it's decoration.
The four kinds of metric (and when each is useful)
An effective dashboard balances different kinds of information. Mixing them up is one of the most common mistakes:
1. Status metrics (what's happening right now)
Examples: number of orders in progress, open tickets, active projects. Useful for daily operational management. Should be updated frequently (real-time or close to it) and visible to whoever does the work.
2. Trend metrics (how we're doing over time)
Examples: revenue week over week, conversion month over month, average delivery time. Useful for understanding whether you're on the right track. Daily or weekly refresh is almost always enough.
3. Anomaly metrics (something is off the scale)
Examples: a customer who ordered three times their usual, a chronically late supplier, a process that's running longer than a threshold. These are the data points that trigger action now. Treat them as alerts, not as charts.
4. Strategic metrics (overall health)
Examples: annual margin, customer churn rate, average revenue per customer. Useful for long-term decisions. Monthly or quarterly refresh is right.
Putting all four on the same screen, at the same weight, is the fastest way to make all of them invisible. Each has its own space, its own refresh cadence, its own audience.
How to design a dashboard people actually use
A practical sequence, in six steps:
Step 1 — Define who'll use it and when
A dashboard "for everyone" is a dashboard for nobody. It always has to be designed for a specific role, at a specific moment: the production manager at 8 AM before work starts, the salesperson at 5 PM before closing, the founder on Monday morning.
Different role, different dashboard. Even if the underlying data is the same, the presentation isn't.
Step 2 — List the concrete decisions
For that role and that moment, write down three to five decisions the dashboard has to support. Maximum five. If you have ten, you're designing two dashboards, not one.
Step 3 — For each decision, identify the data point that drives it
Not the data points. The data point. The main one. The others are context, the "why," but the number that drives the decision is one. Try to keep it singular.
Step 4 — Add thresholds, targets, comparisons
Any number alone is mute. It always has to come with:
- What "good" or "bad" means (threshold or target)
- Comparison to a previous period (improving or getting worse?)
- Recent trend (the last 4–8 observations)
Without these three elements, even the right data won't drive any decision.
Step 5 — Make action immediate
When the dashboard signals a problem, the action has to be one click away. If the dashboard says "three projects more than five days late," it has to take you to the exact list, from there to the single project, from there to the chat with the manager or the button to reassign. No "open another system." No "send a manual email." Action follows signal.
Step 6 — Measure whether the dashboard is being used
A dashboard is an operational tool. Like any tool, its usage has to be measured: how many people open it, how long they stay, which widgets they click. A dashboard that doesn't get opened is technical debt, not information.
A concrete example: the same data shown two ways
To make the point concrete, the same data presented decoratively and operationally:
Decorative: "You have 12 active projects" (a pie chart split by status).
Operational: "3 projects are over 5 days late — click to see which. 2 have been stalled for over 3 days — owner is X. This month's revenue is 18% under target."
The first dashboard is a snapshot. The second is a list of actions, starting with the most urgent problem.
Same data, completely different functions.
Three antipatterns to avoid
1. The "cockpit" dashboard packed with numbers
Saturated screen, ten widgets, five colours, and a feeling of control that lasts two weeks. After a month nobody looks. Reduce, simplify, one decision per widget.
2. The dashboard that "shows the CEO everything"
Strategic and operational metrics mixed together, real-time, on a single screen. Result: the CEO gets distracted by micro-operational variations and stops seeing the strategic trends. Separate the two dashboards.
3. The dashboard with no ownership
Nobody is accountable for its quality: numbers don't get checked, errors don't get fixed, obsolete metrics stay there. Without a clear owner, the dashboard rots in six months.
When custom is the right choice
Tools like Looker Studio, Metabase, Power BI or Grafana cover 70–80% of cases. For the rest — when you need the dashboard deeply connected to your business software, triggering actions, with sector-specific logic — a custom dashboard is the right choice. Typically when:
- The action triggered from the dashboard is specific to your domain
- The data sources are many and standard tools don't integrate them well
- The number of users is high and per-user costs become significant
- Fine-grained permissions are needed (each department sees only theirs)
In those cases, the dashboard isn't a report. It's a piece of the company's operating system. And it has to be designed that way.
In summary
A useful dashboard isn't the one with the most charts. It's the one that, every time it's opened, makes what to do next clearer. Start from decisions, not data. Measure usage, not just looks. Connect every number to a possible action.
If your current dashboards get looked at and closed without anything changing, they're not dashboards. They're coloured wallpaper. Changing how they're designed is one of the fastest returns an SMB can get — better data, fewer meetings, faster decisions.
Conosciamoci.
Una call di 30 minuti, senza impegno, per capire se posso esserti utile.
Prenota una Call Gratuita
Aiuto agenzie e PMI a costruire sistemi digitali su misura per i loro processi reali.